Dashboards with detailed insights, guidance and metrics
Analytics and reports providing quick view of your content performance, competitive metrics, trends and key performance indicators
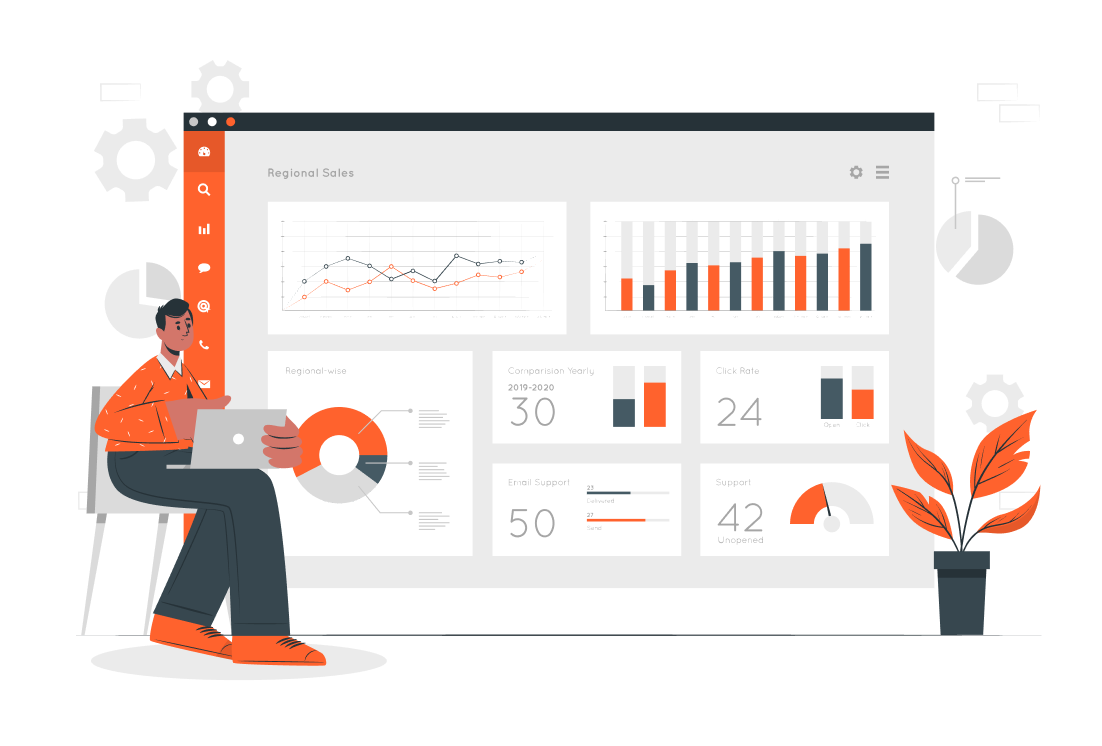
Dashboard for instructors, content creators & podcasters
High-level views with drill-down, recommendations and notifications into content performance and trajectory vs. the market and competition
Measurements, inputs and notifications for what matters most
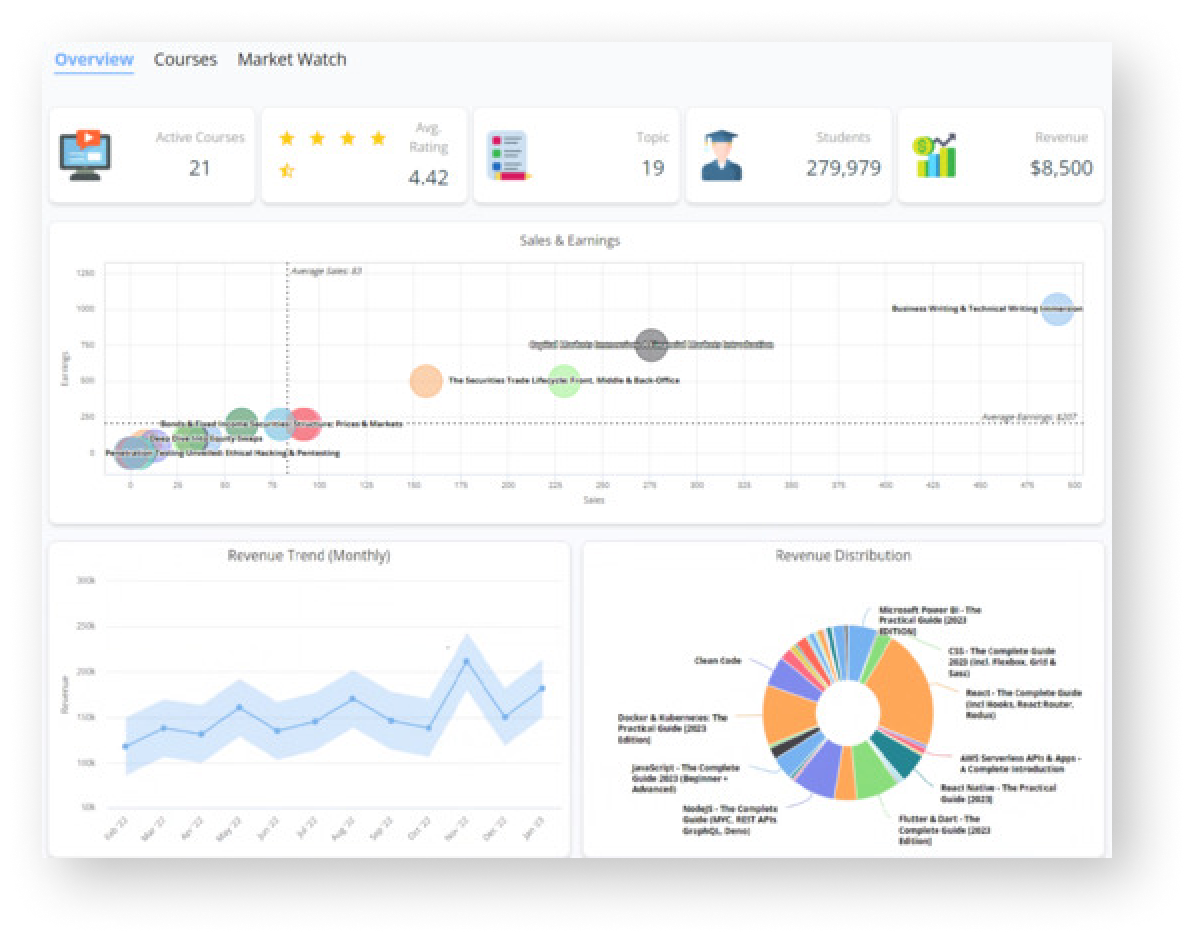
 Analyze overall content health and sales performance
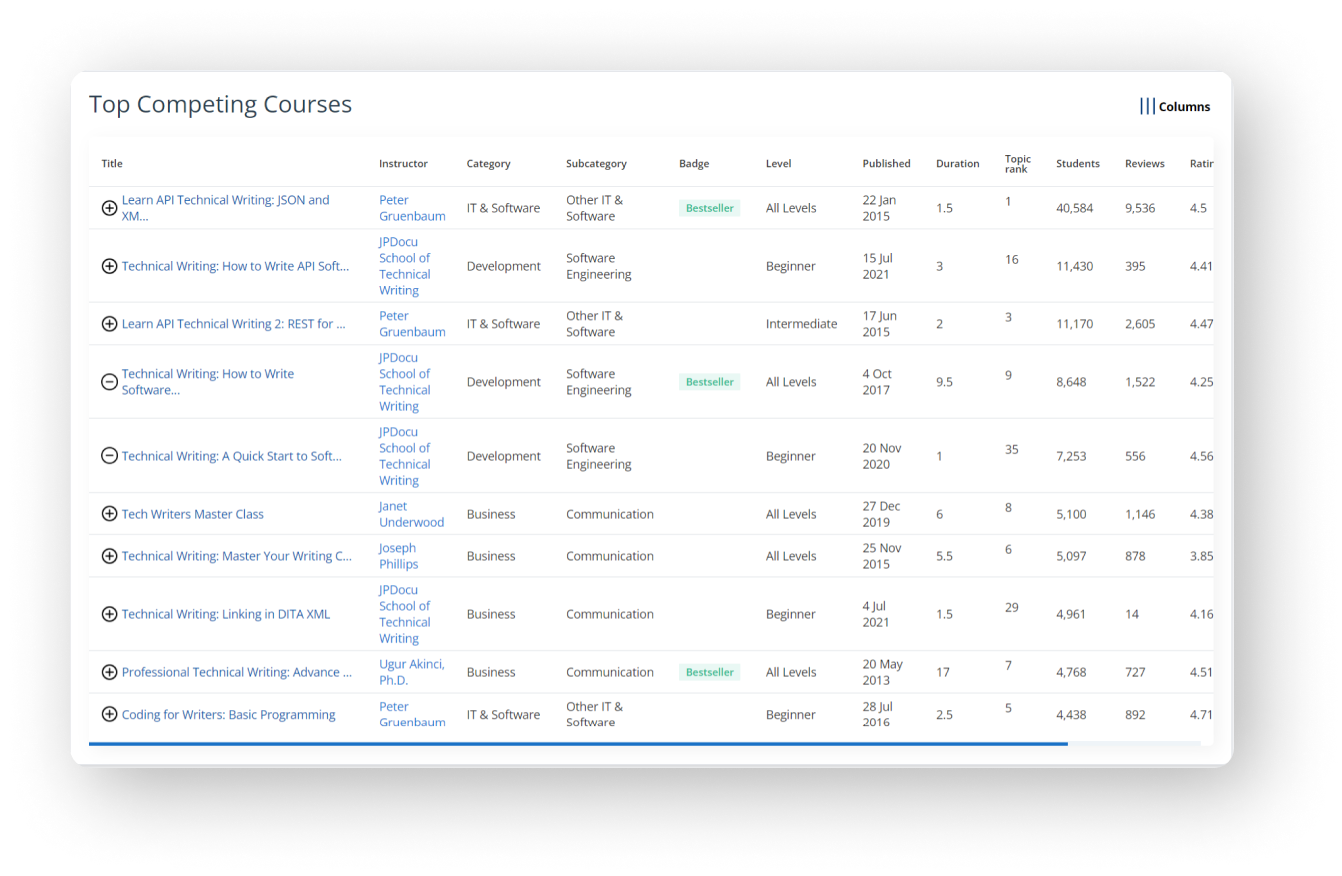
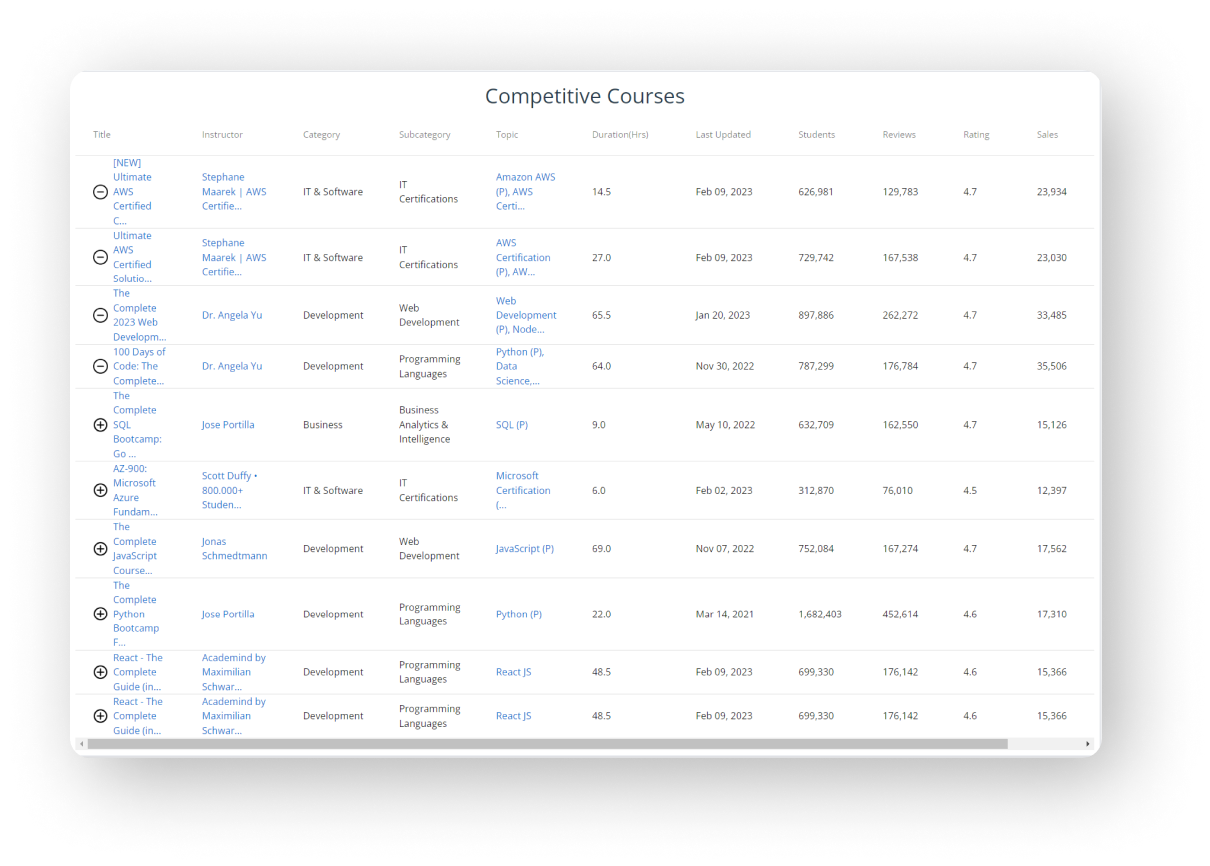
- View comparative content performance dynamics, trends and rankings along quality and sales axes
- Get notifications of competitor content releases, keyword changes, and ups/down in market trends
- View our “Keyword Matrix” rankings, trends, ideas, and difficulty for your content
- Build customizable “Market Watch” dashboards from recommendations and trackers you set in motion
Notifications to keep you on top of your competition
- Set and receive content and sales push in area of interest (onsite, email, SMS)
- Define personalized thresholds to track competitors, courses, keywords…
- Competitive intelligence tools track key course and content releases
- Identify early mover opportunities with niche topics
- Get a faster start with great new ideas pushed to your desktop and phone
Let market watch insights do the hard work for you
- Machine learning algorithms provide dashboard tracking recommendations
- AI and other tools generate content ideas and feedback
- Personalized market watch guidance helps you improve your current content
- Identify multiple areas of interest and let market watch do the tracking and measurement for you (including competitors, course details, keywords, topics…)
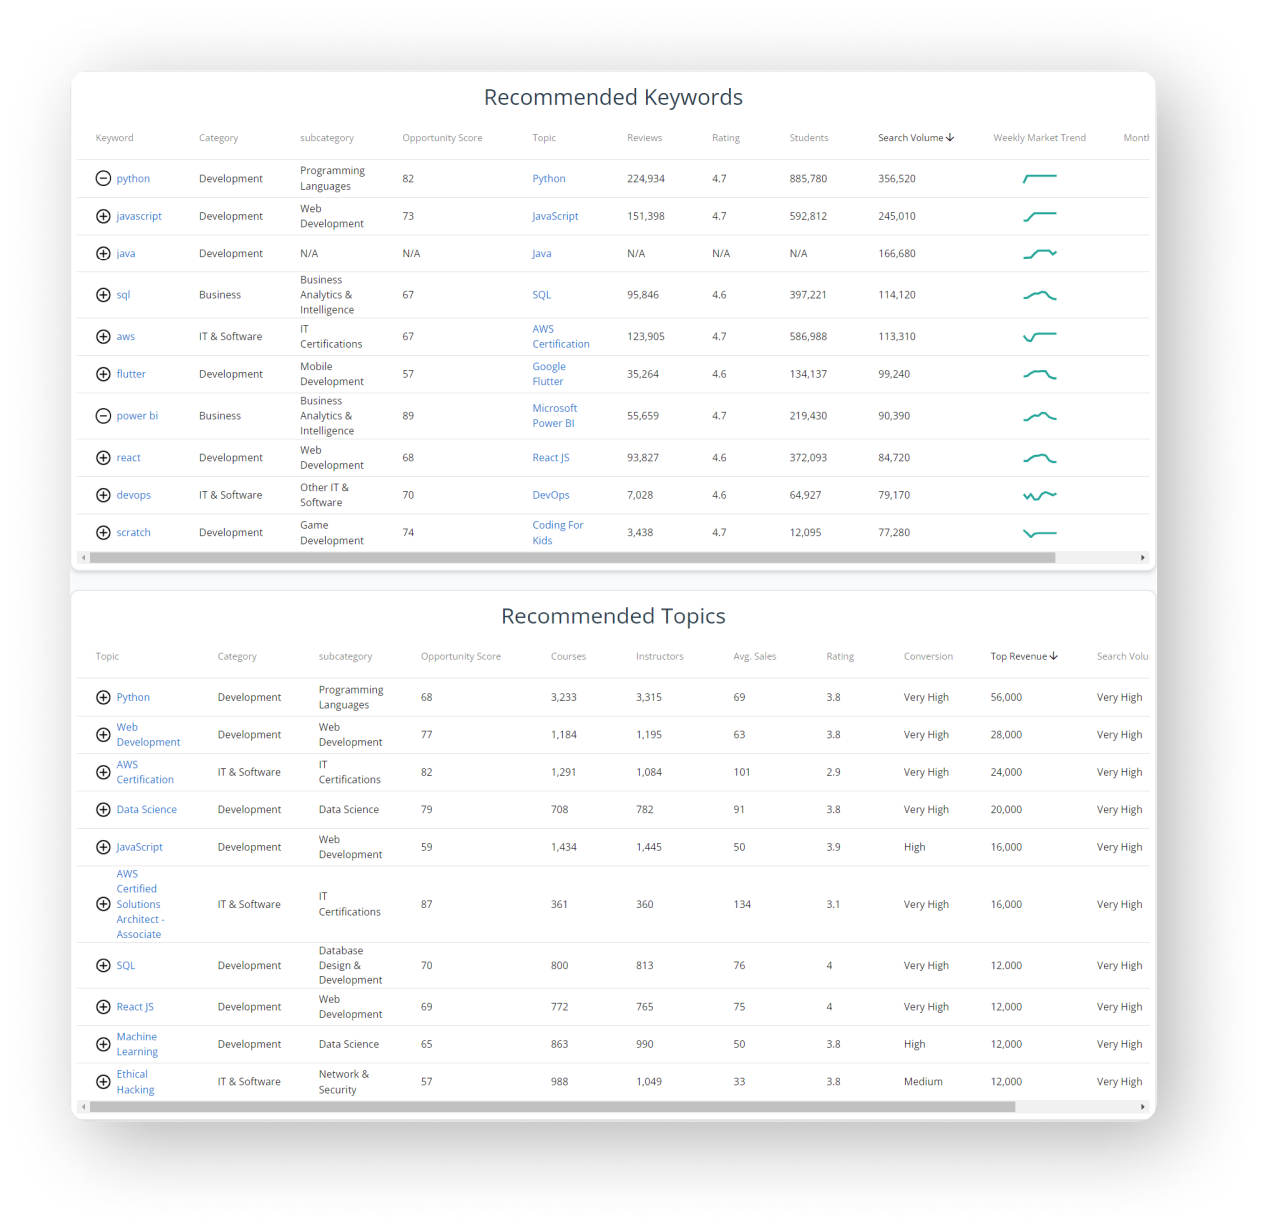
Simplified graphics, reports and visualizations
- Your dashboard centralizes visualizations and provides clear and simplified insights and guidance
- A wide range of charting visualizations are available: line and bar charts, bubble diagrams, scatter charts, range series, word-clouds and many more
- Visualizations provide clarity, simplifying complex information, and communicating key trends or patterns in data that are otherwise difficult to see
- Powerful visualizations are easier to help you understand, retain and take action on key facts (people process visual information more efficiently than text)
- Mobile friendly graphics make on-the-go use a snap
